Alternatively, for more advanced users, here is another idea you can create if you want to practice with the pen tool to create an infographic on a historical topic you are interested in. Refer to the file Mining_History.ai. I created a more detailed infographic that could be used as a whole or in several parts. It is an illustration of a mine shaft and how miners would extract gold from the mine in the early days in the North, from the permafrost, and then pan the gold afterward. Refer to Figure 9-17.
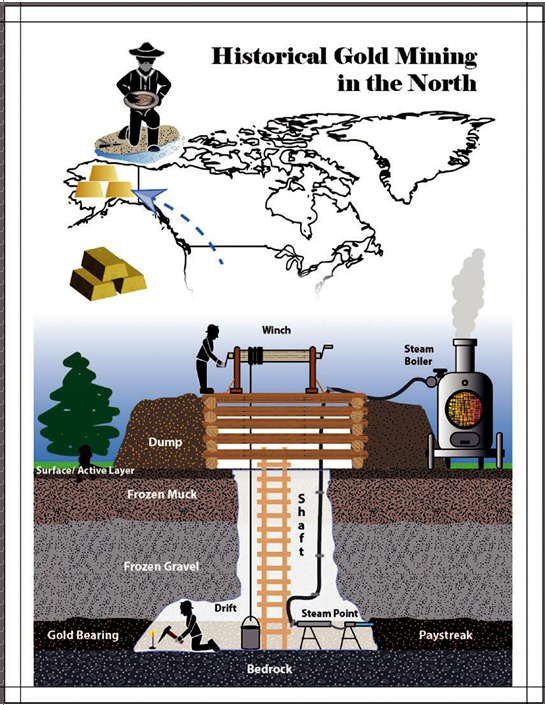
Figure 9-17. Example of a historical mining map illustration

Figure 9-18. Use the Layers panel to add more layers for organizing your infographic for easier editing
This mine shaft example was created from looking at and researching the topic of historical mining and viewing various photos of the process used, machinery, maps of that era, and soil layers and then creating a simplified drawing with my own art based on the description of permafrost layers and soil. This design also included part of a world map in the background. You can access a copy of this map, see World_Map.tif, and then use the Image Trace panel to extract a design from a raster image and make it vector art. I will mention how to use the Image Trace panel in Volume 2. For now, if you want to use the current vector map (see Map layer), you can copy it out of the current infographic and paste it into your own file for practice. As you can see in the Layers panel, in this project, more layers were required to organize all the shapes and paths, and some had to be locked so that I could move other paths on the artboard. Refer to Figure 9-17.
As in the previous infographic resume, I used the Pen tool again as well as the Blob Brush and Eraser tool. Some paths had their opacity altered so that the mine shaft appeared as a 3D-like effect. For ladder, I used a lighter color to give a lower contrast so that it was not focused. However, the winch for the bucket and the steam boiler hose were more in focus and used darker colors. Text was made white and bold when it was over darker colors. Refer to Figure 9-19.
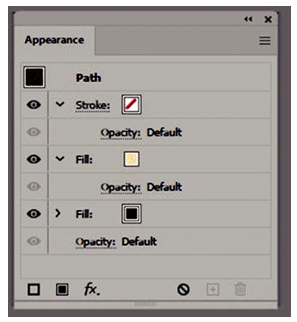
Figure 9-19. Use the Appearance panel to add more overlapping strokes or fills to a path or shape