As a beginner, if you are having difficulty drawing some more complex shapes for your infographic, you can use the symbols in the various libraries such as web icons or web buttons and bars. Refer to Figure 9-6.
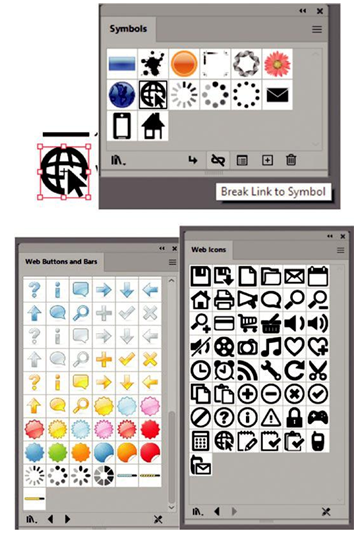
Figure 9-6. Add the graphics to your Symbols panel from libraries, or break the link and use symbols present in Illustrator’s other libraries if you need symbols to practice with
Once you drag out the symbol onto the artboard, you can then break the link to edit.
Refer to Figure 9-6.
Also, other fonts that you can use and then modify for your infographic are Segoe UI Symbol, EmojiOne Color, and Segoe UI Emoji. Use the Type tool and click your artboard, and while the type is highlighted, use your Glyphs panel to add the text and then select it with your Selection tool, then choose Type ➤ Create Outlines. Then you can modify the
grouped outline to suit your needs with the use of a combination of the Direct Selection tool and Pathfinder panel and colorize if required using the Control panel. Refer to Figure 9-7.
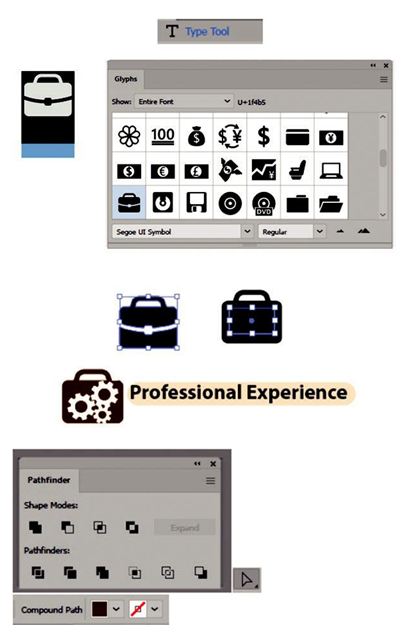
Figure 9-7. Use the Glyphs panel to edit fonts that are turned into outlines and then use the Pathfinder tool further to edit and combine your icon shapes and the Direct Selection tool to color some areas using the Control panel
Note With color fonts, you may need to first delete all the highlighted placeholder text before you can click to add the emoji to the text path and later create an outline from it. Refer to Figure 9-8.
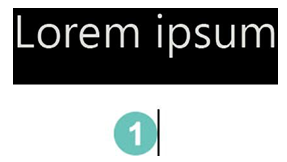
Figure 9-8. Delete your placeholder text using the Type tool before you add a color emoji from the Glyphs panel that you plan to outline and edit
We can see a few examples of created and modified icons throughout this resume; some are placed by the heading to give them more meaning.
In my case, rather than using a photo, I created an illustrated image of Jane Johnson and her cat and then, above her head, placed some of the items she can create for you.
I used the Pen tool, Eraser tool, Paintbrush, and Blob Brush tool to create her and the cat. Likewise, you could put your logo here if you are still working on your drawing skills, or like you traced over the light bulb mock-up, you could trace over a photo which could be placed as a linked file in Illustrator on a separate layer below the art and then be removed afterward or the layer hidden. Refer to Figure 9-5.
While doing research, I noticed that many infographic resumes, when describing software expertise, used a type of pie graph or bar chart to describe the level of skill in that particular software. While we have not discussed pie charts yet, but we will in Volume 2, you can for now use the Ellipse tool to create circles and then use the ellipses start and end pie widgets to divide into wedges or segments to create a pie chart-like affect. In my case, I created a grouped path that consisted of Alt/Option dragged copies of ellipses and, then using the star tool with ten points, moved an ellipse at each point around and grouped the shapes. Refer to Figure 9-9.
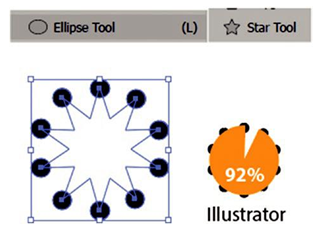
Figure 9-9. Create a faux pie chart using the Ellipse and Star tool